How we created a human analytics platform for teams instead of using Google Sheets
Vital is a human analytics platform, currently in the MVP stage. With Vital, you can track your personal data such as book readings, time spending, daily vices, and rituals. The platform makes data tracking social with teams engaging and commenting. It also provides a simple visualization of your data and data analytics that helps people to understand their feelings and behaviors better.
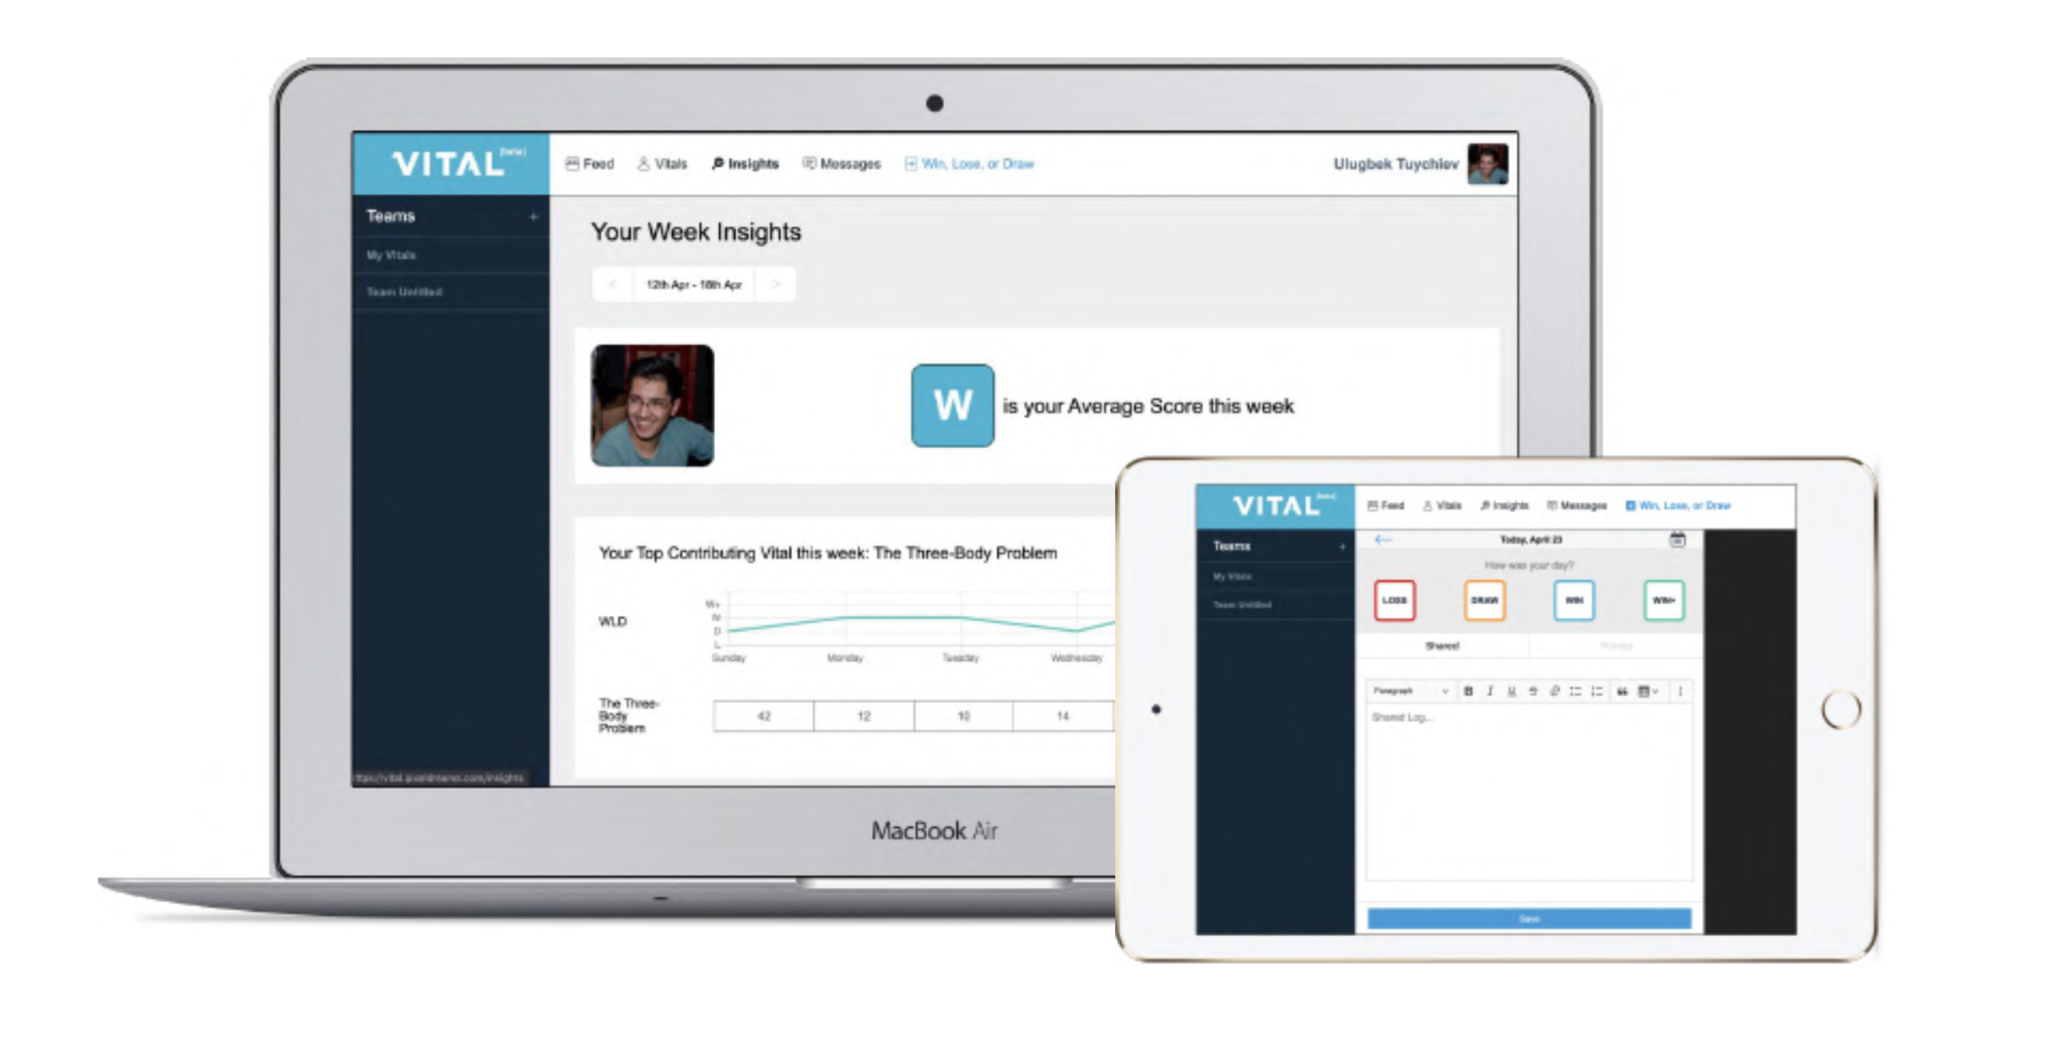
The datarockets team built this platform from scratch and participated in the product strategy, which resulted in several features that have been implemented & adopted.
Challenge
The ultimate goal of VITAL is to improve individual productivity and increase self-awareness when working with teams. Our client, the Pixel Dreams team, started with simple journaling using Google Spreadsheets in order to validate their concept. They started logging their productivity on a daily basis as well as the factors that influenced this intending to try to find correlations between their personal data and the entries of their teammates. Here is how the proof of concept looked in Google Spreadsheets:
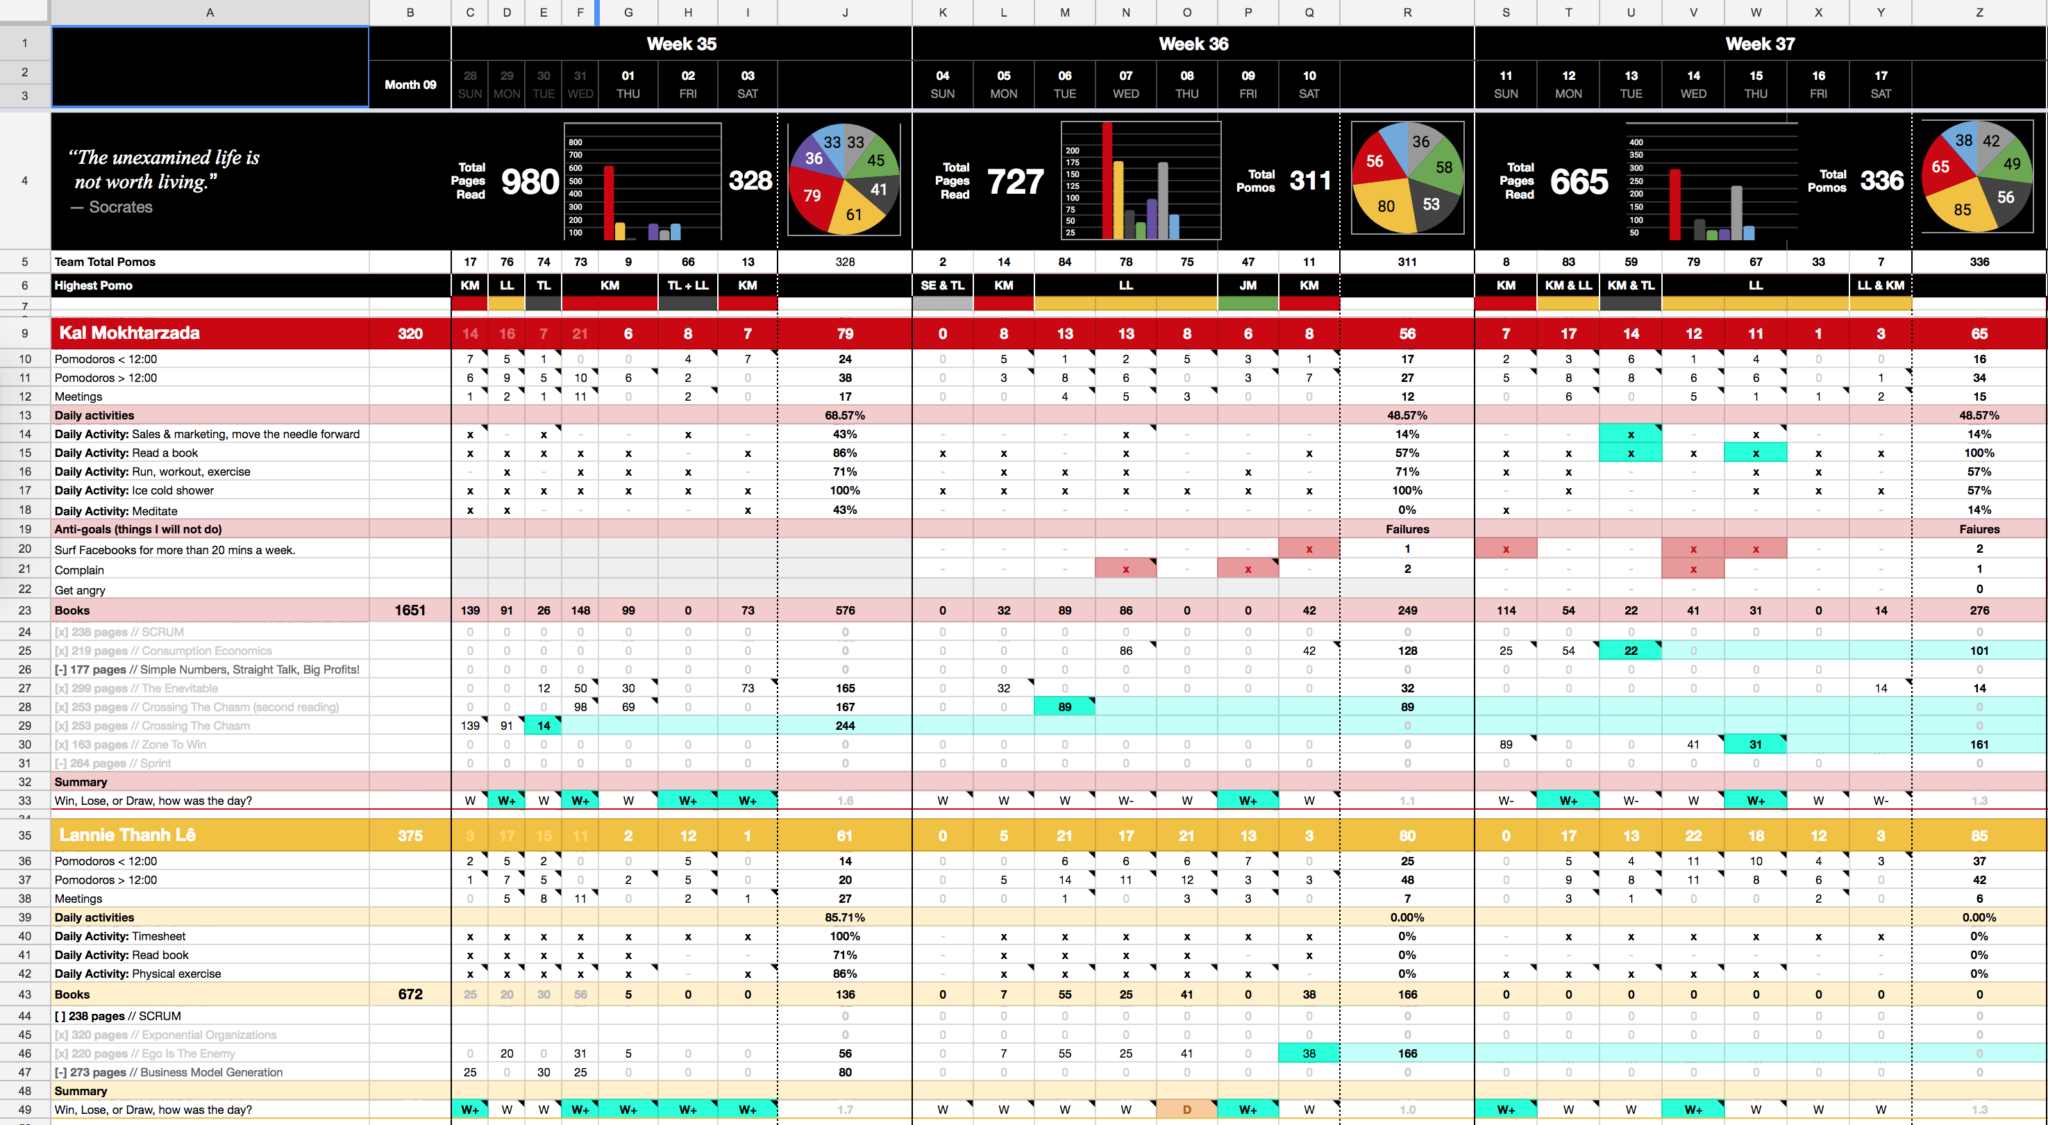
The guys have already proved to themselves that their data was valuable but they were struggling a lot with the spreadsheets. It took hours of work to set up spreadsheets for new members as well as initiate data entry for new time periods. Moreover, the spreadsheet solution wasn’t scalable at all and it wasn’t possible to share VITAL’s ideas with new people while the application was based on spreadsheets. So, we had to solve the following 2 challenges:
- Making the data entry process more convenient
- Providing value from data entry to teams - giving some motivation to fill in data every day
Our Approach
First version release
We couldn’t utilize spreadsheets anymore and decided to implement a custom web application that would fulfill the data tracking needs. First of all, we focused on the data entry UI. Being a creative agency, Pixel Dreams provided us with the first version of the design, which looked like the following screenshot:
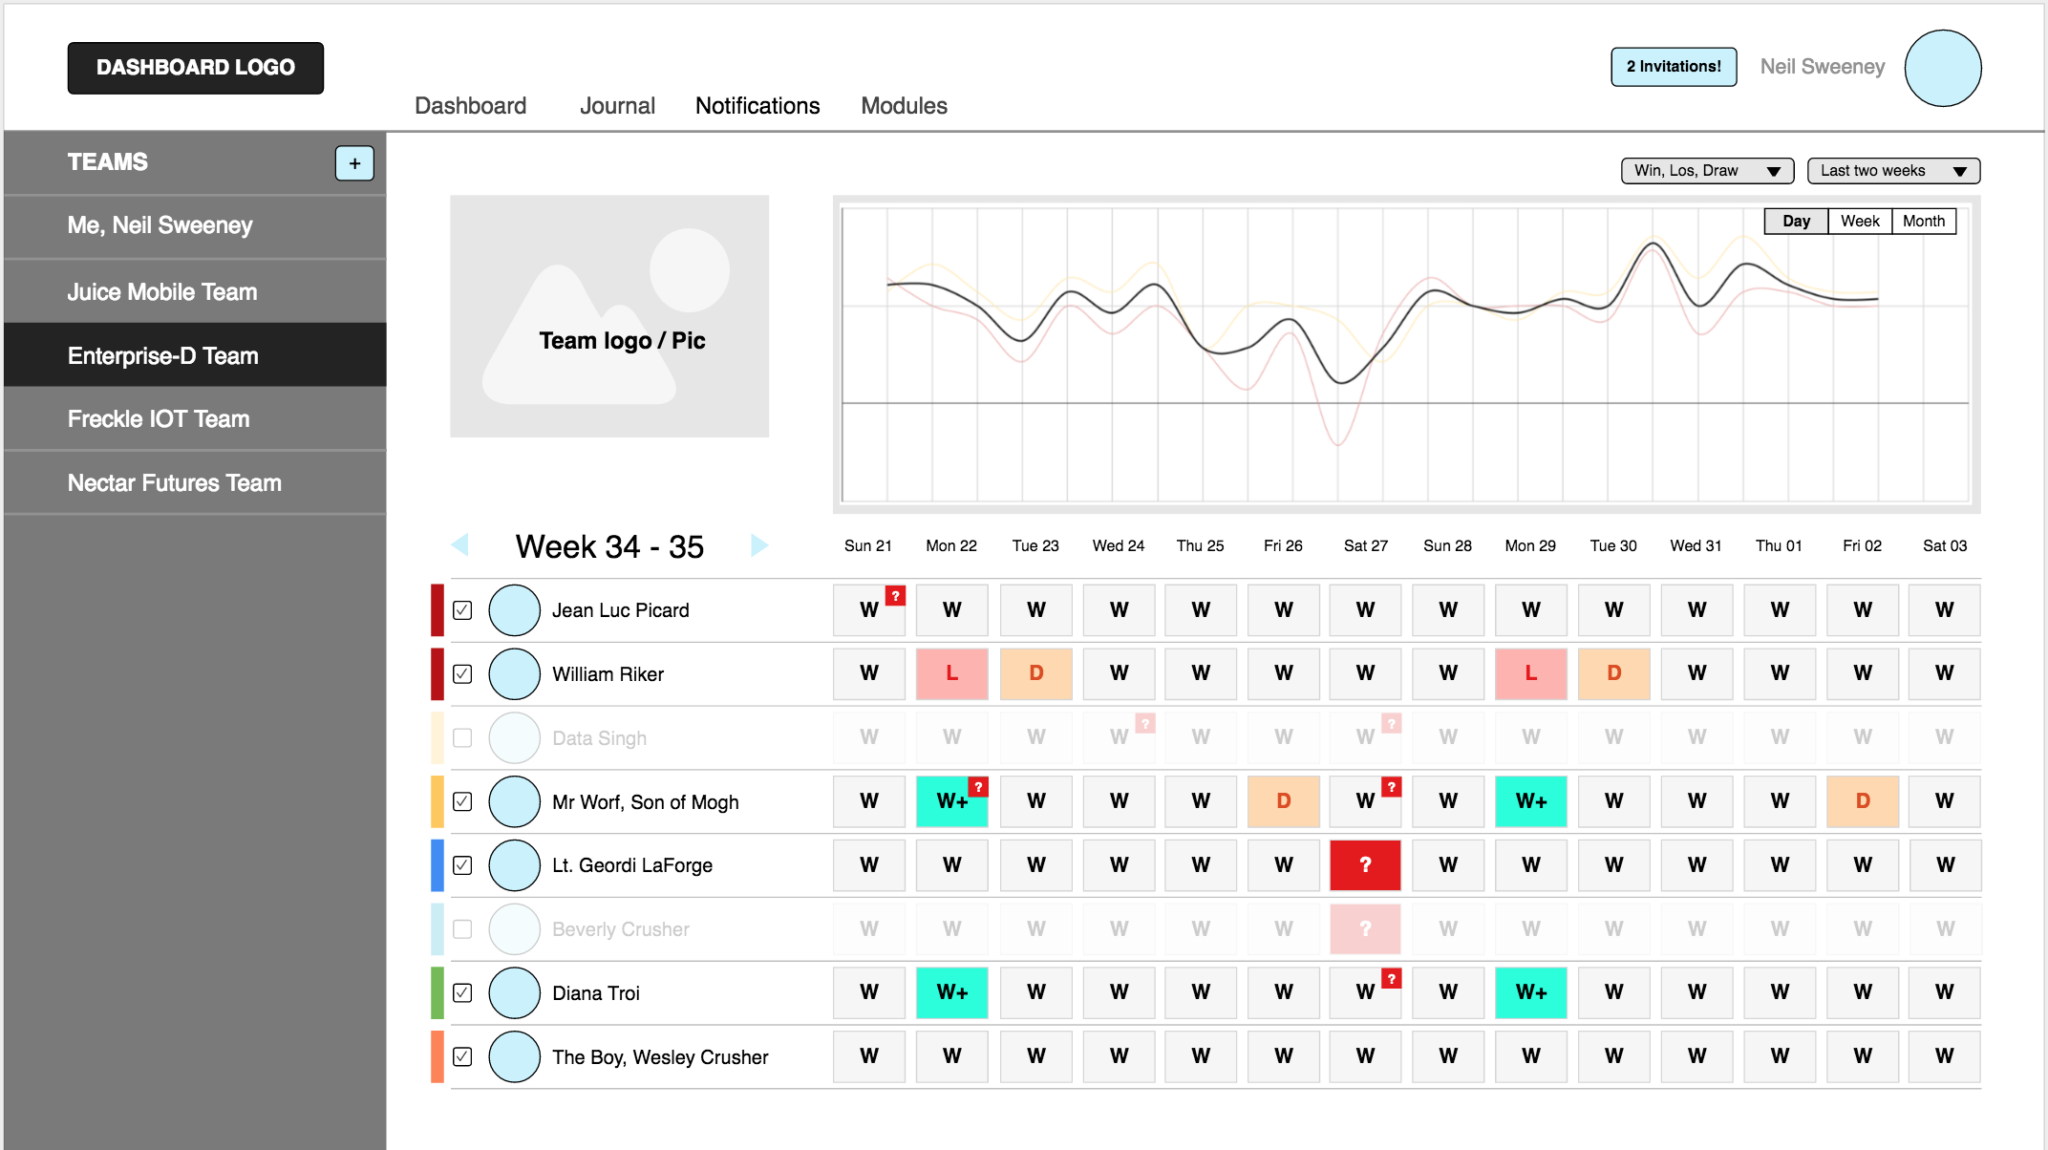
The application required instant data updates w/o page reload so we decided to use a reactive framework on the frontend, and at that time, React.js was growing popular. We picked React.js + Redux for the frontend and Ruby on Rails for the backend. For the design, we utilized bootstrap to release the first version of the product fast.
In order to motivate people to track their data, we decided to introduce a concept of teams and data sharing. As a result of the first iteration, the users were able to transition from their spreadsheets to the app and the following features were implemented:
- Journaling (Daily entry: Win, Loss or Draw + text log)
- Teams and dashboard for teams configurable by team admins
- Team members’ management, invites via email
- Shared and private logs
- Additional data types as checklists and counters
- Ability to comment on data entries of your teams
- Graphs that visualize Win Lose or Draw metrics within teams
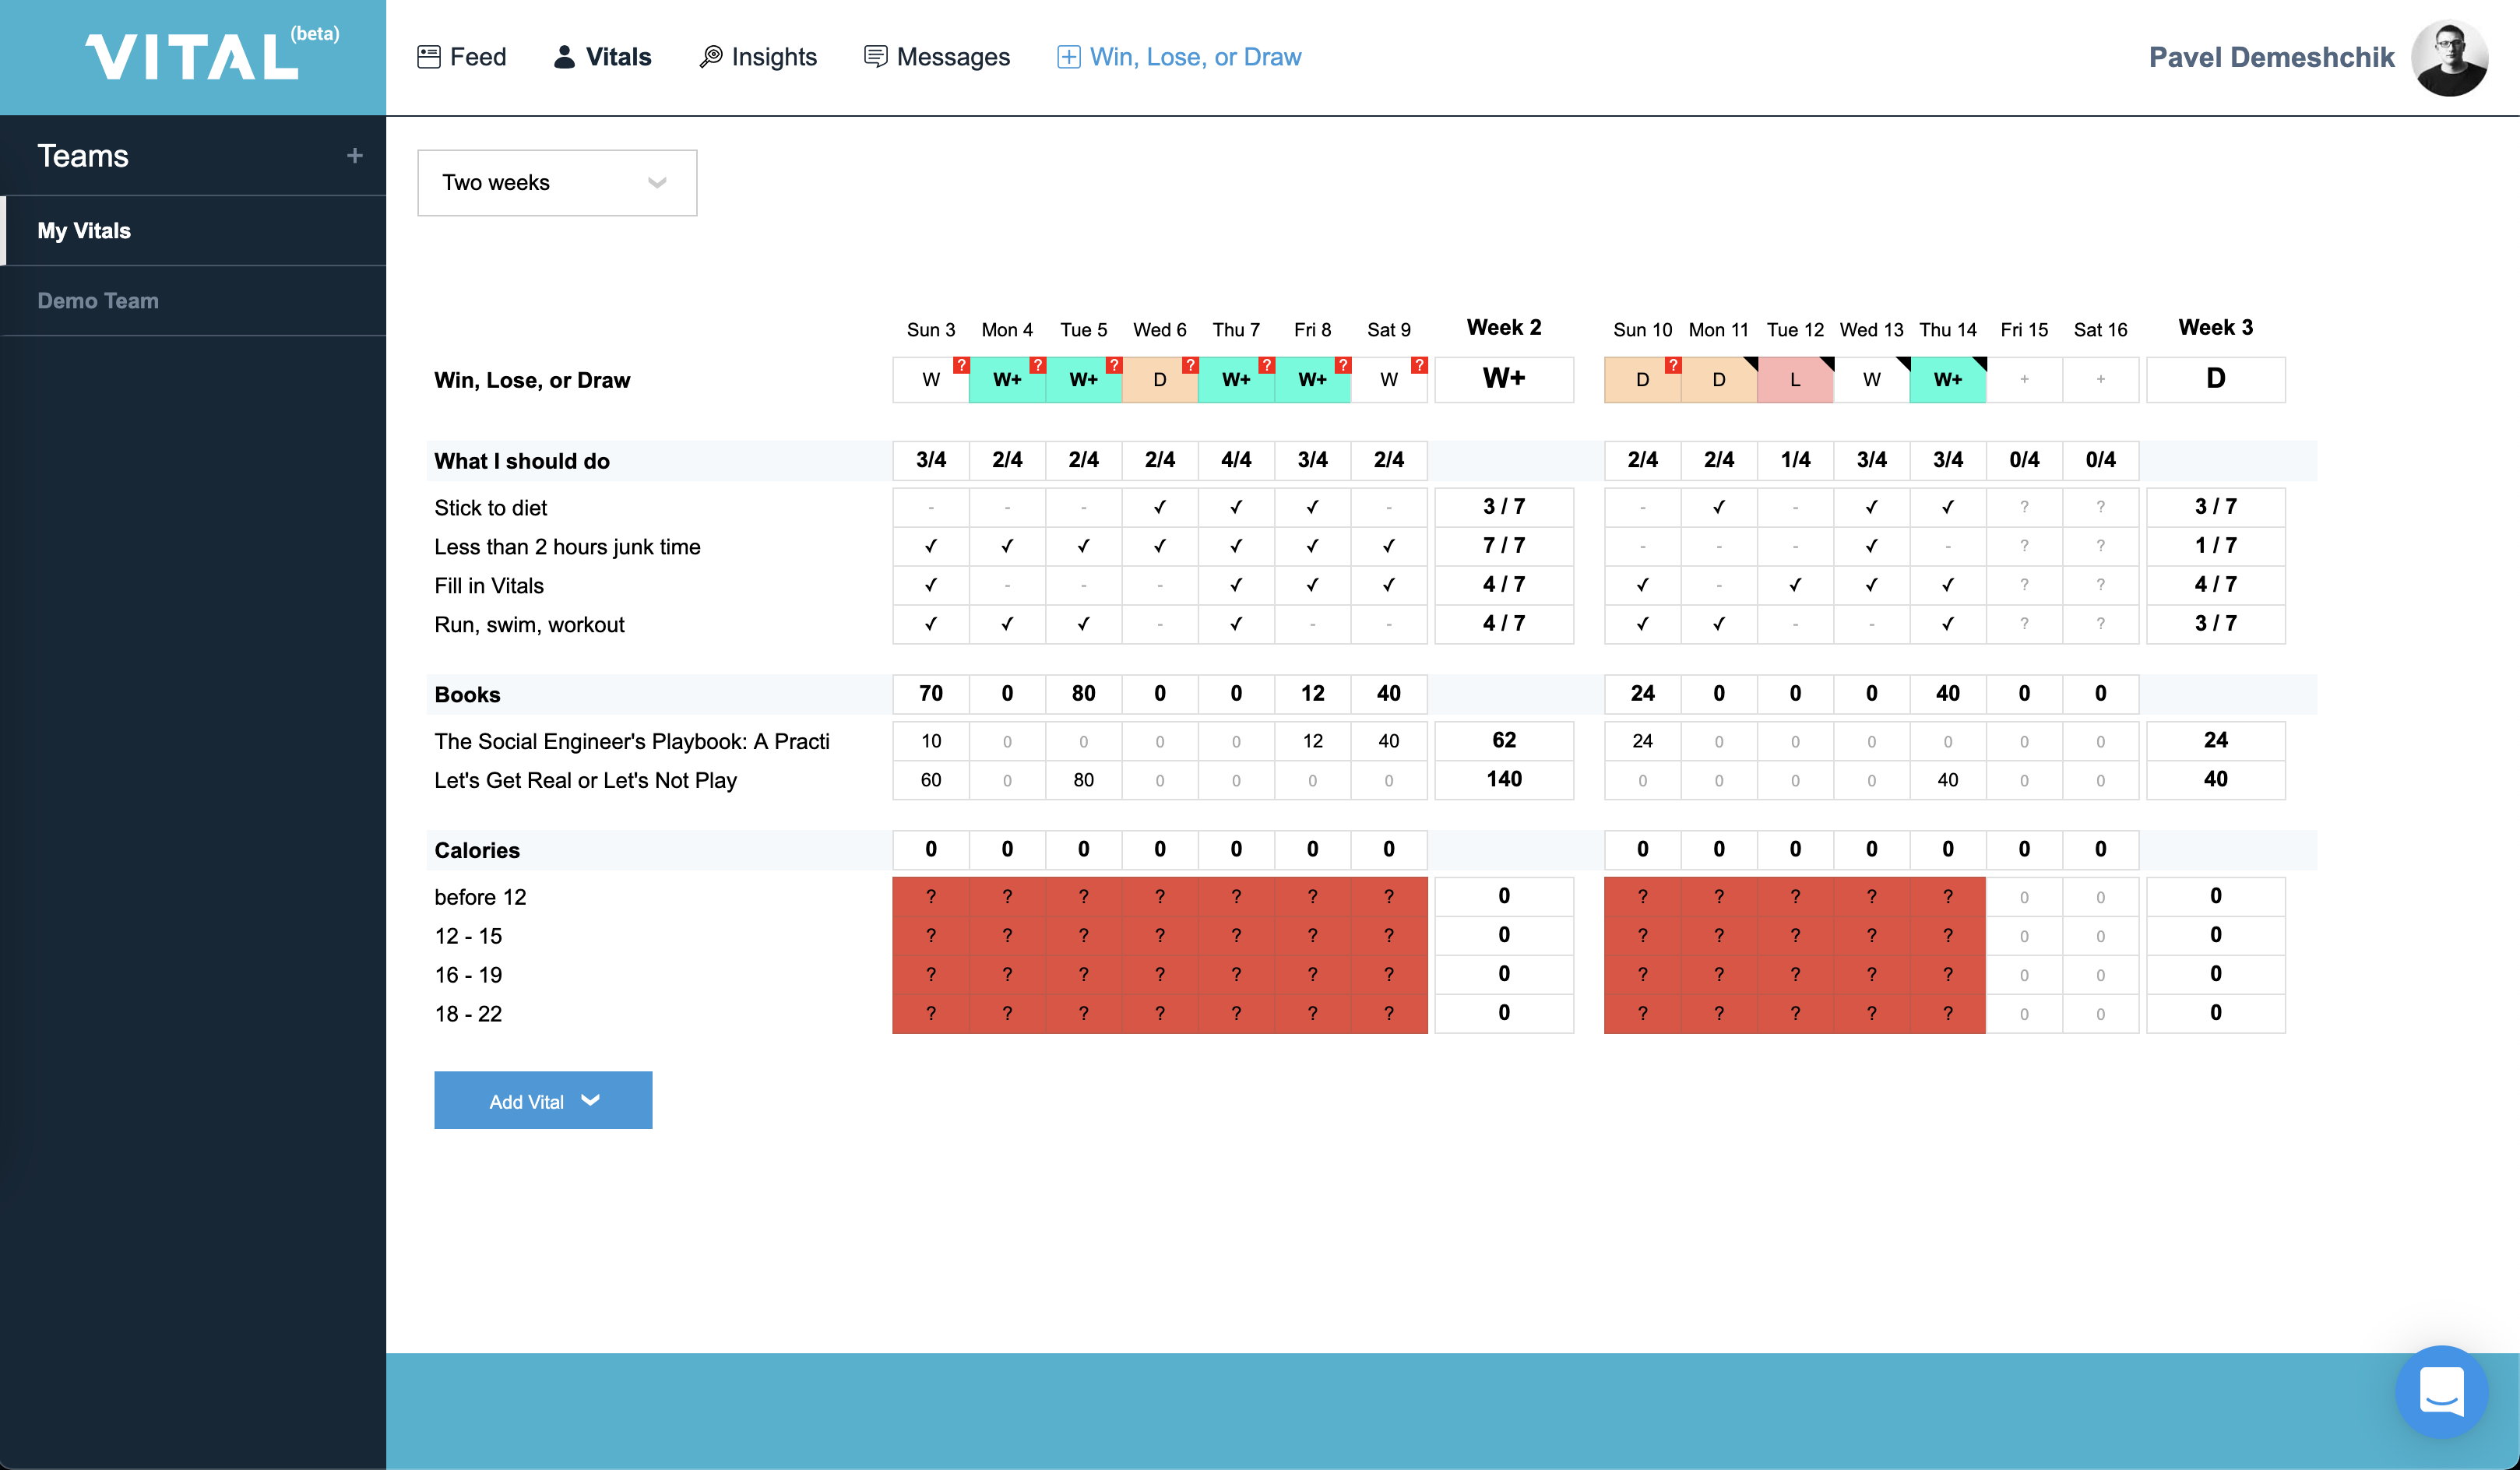
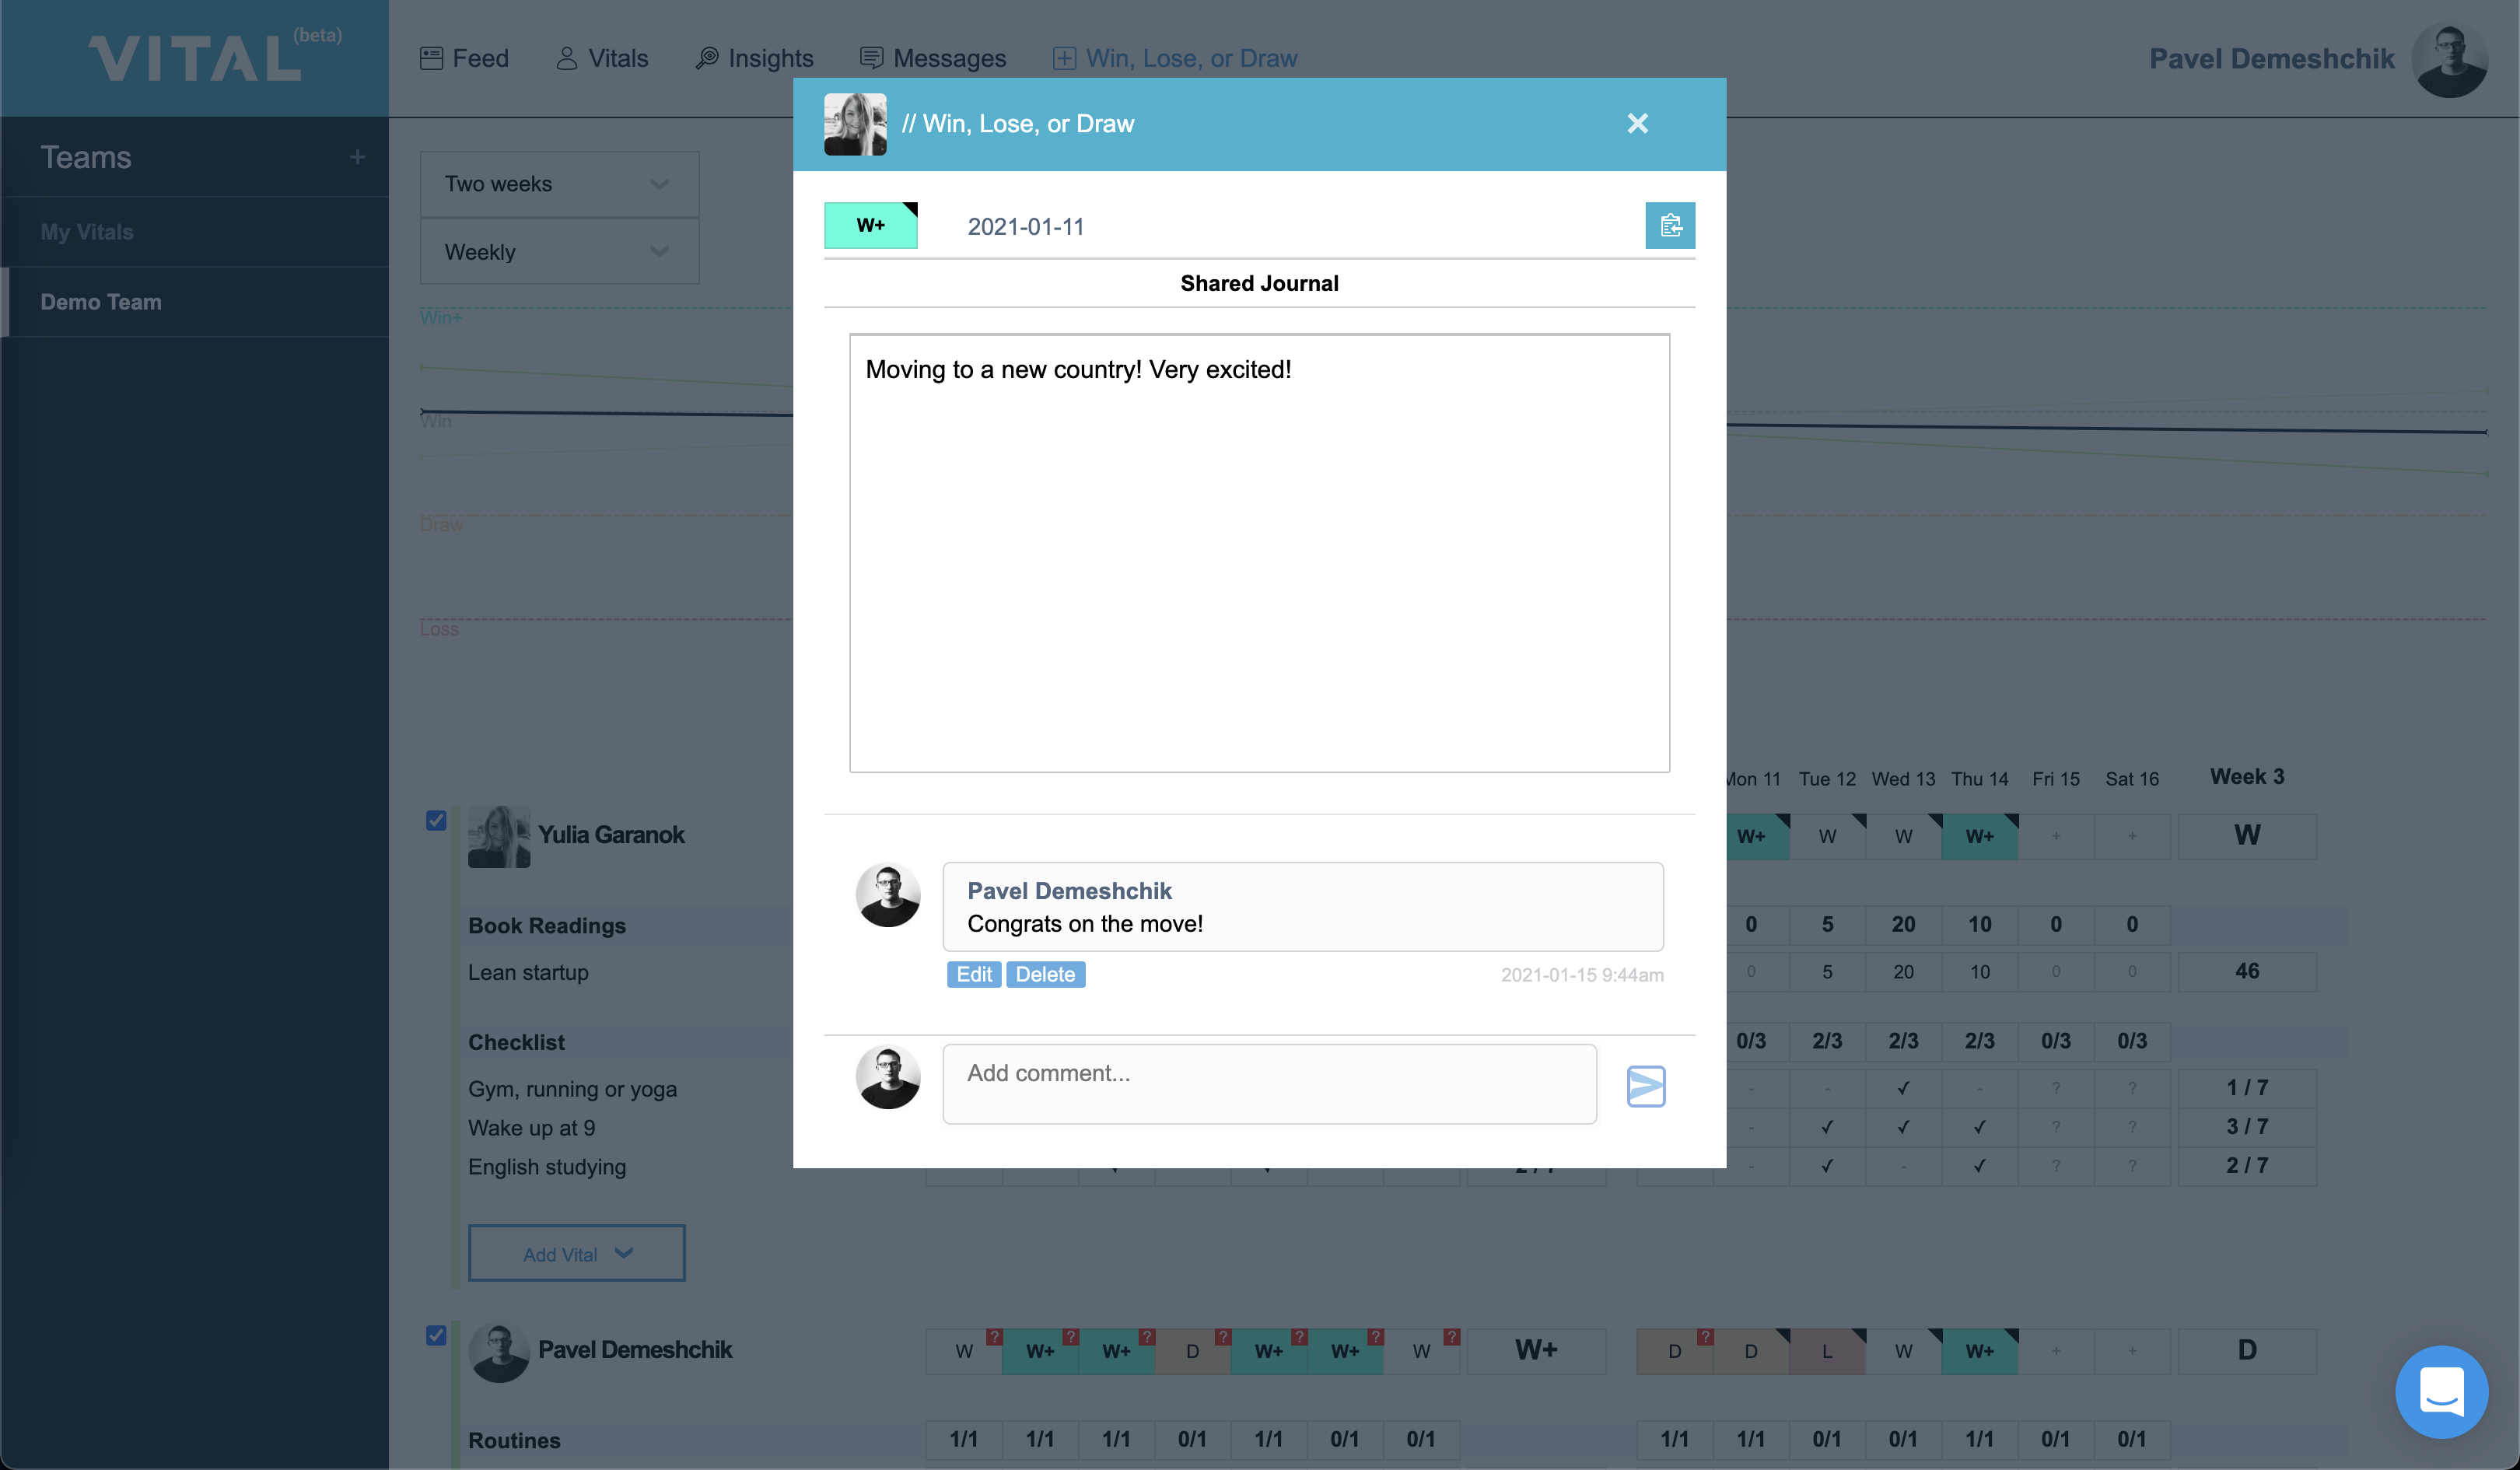
On his Youtube channel, Kal (the founder of Pixel Dreams) invited first platform users for beta testing.
Mobile app implementation and improving UI
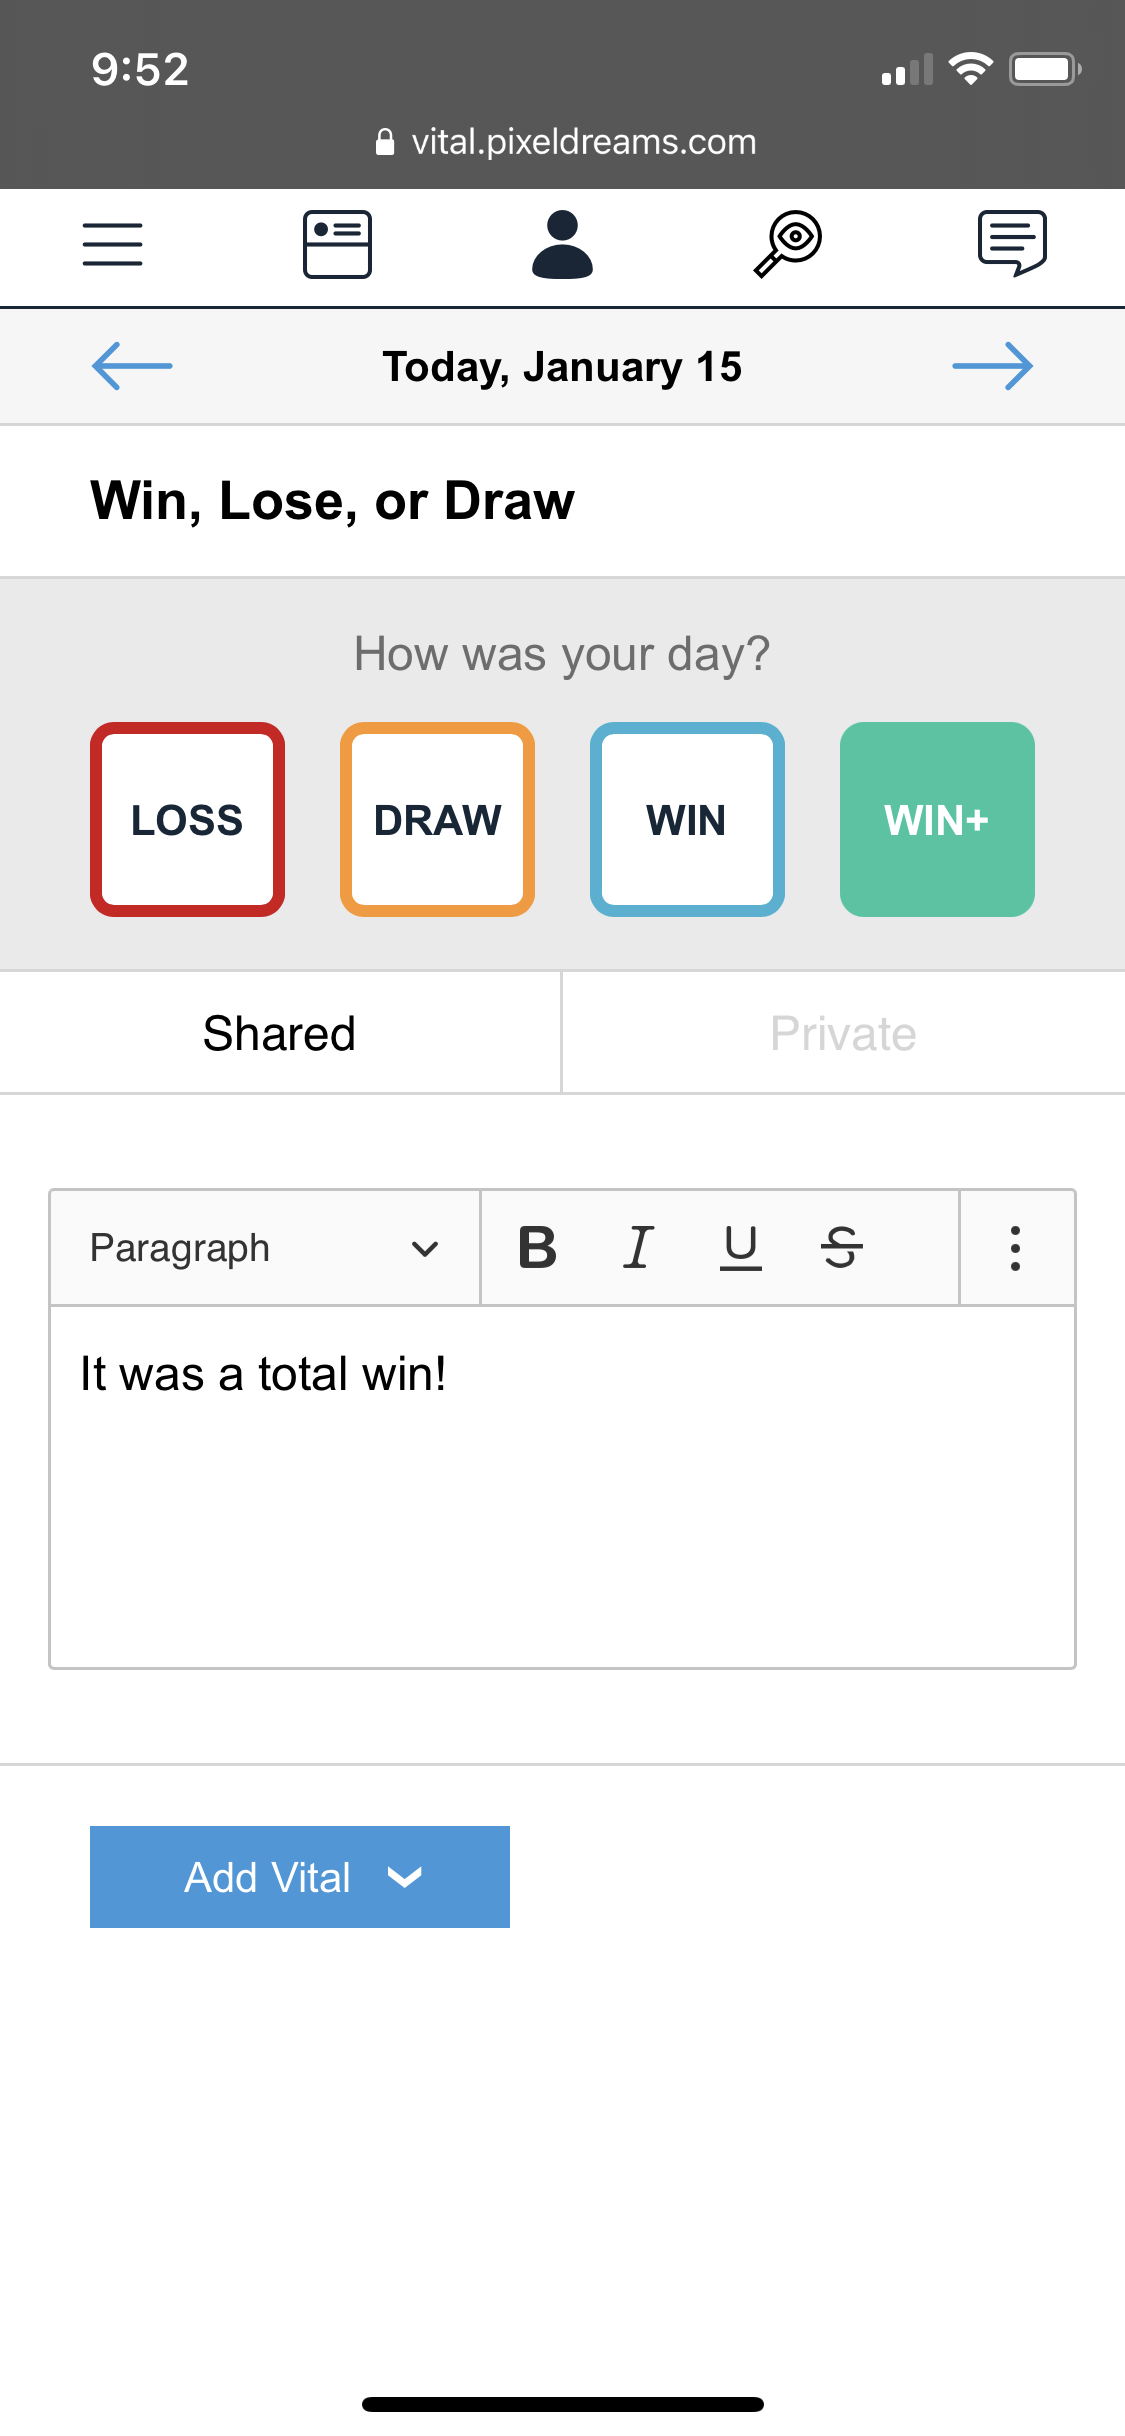
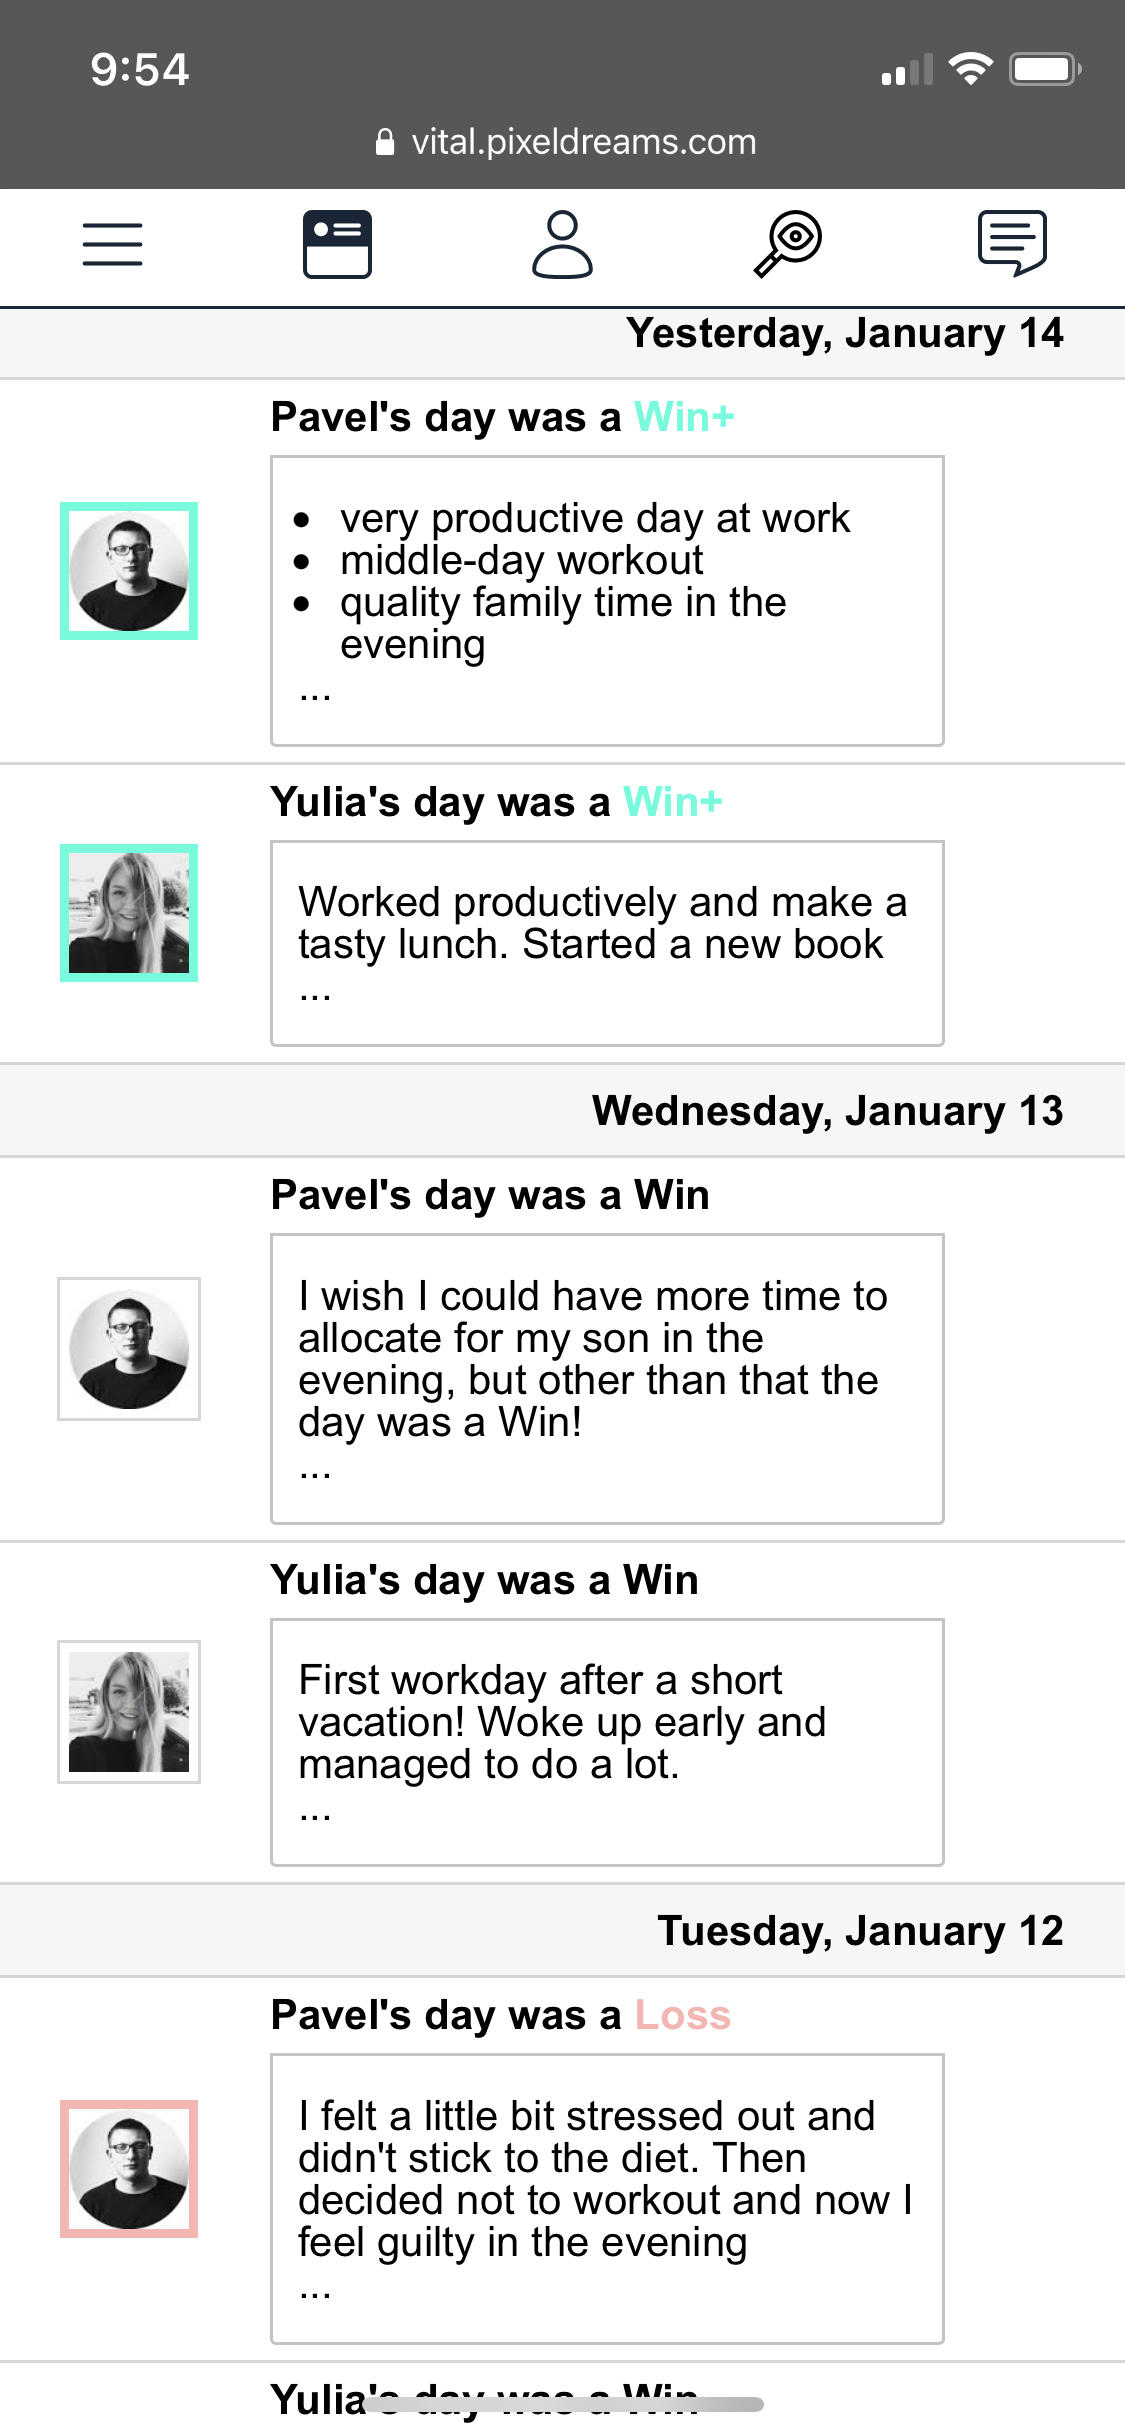
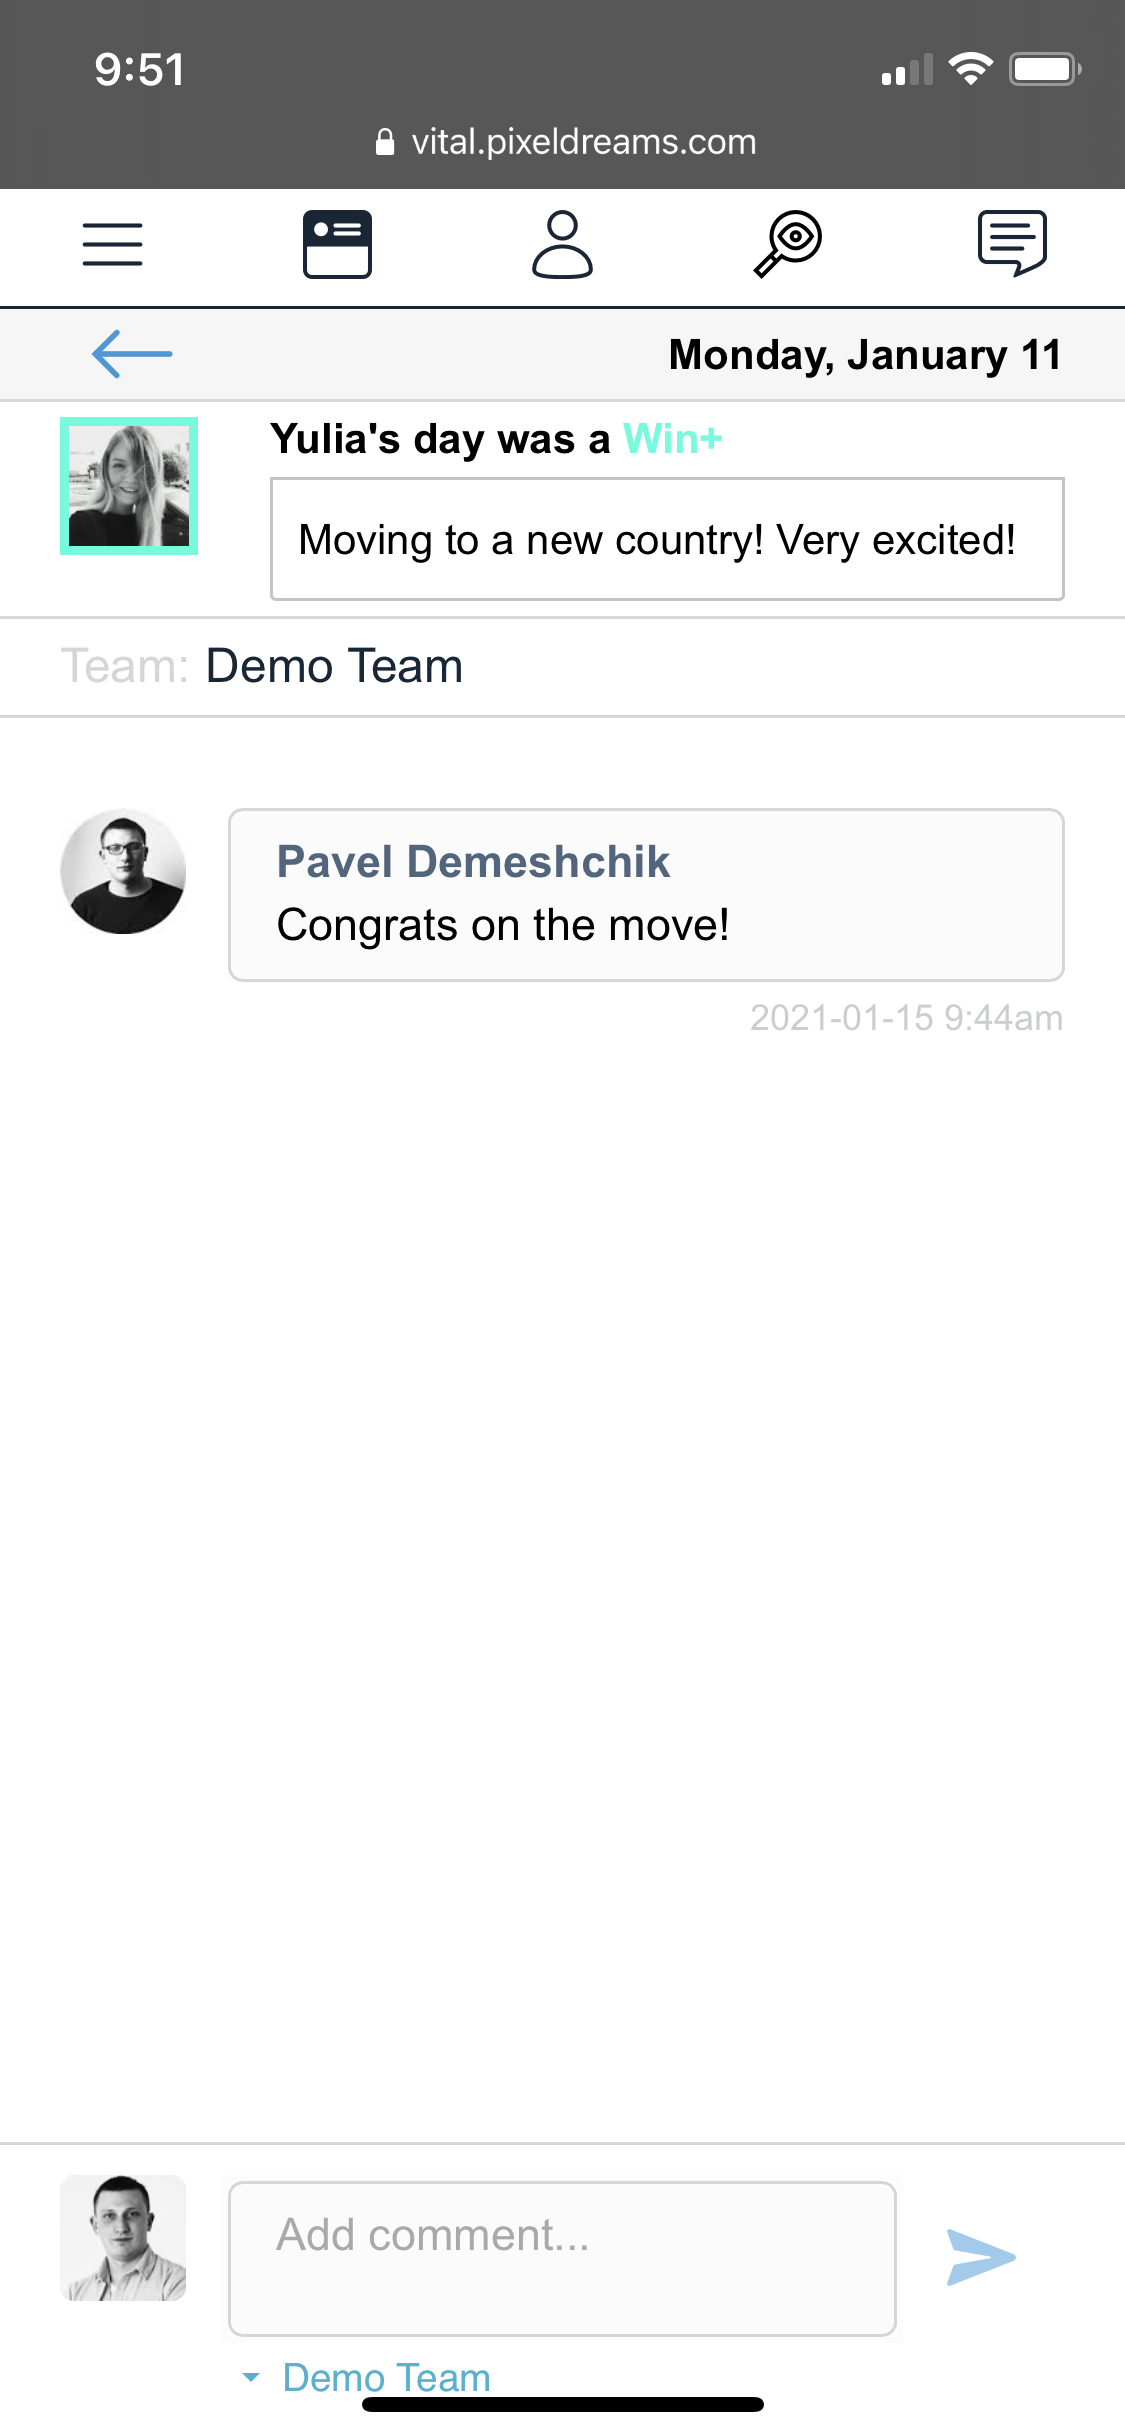
After some time of using the app, we gathered feedback from the early adopters and learned that now when they have an app for data tracking, they preferred to use mobile devices to fill it in. Also, we noticed that the early adopters of the platform were using the commenting feature a lot to support each other and ask questions.
Therefore, we decided to run another iteration and create a mobile version of the web application plus add extra social features such as:
- A social feed where users can see the logs of their teammates and comment on them w/o switching to the databoard screen
- Notifications about new comments so that users could continue their discussions in the comments section
We allocated 4 more weeks in order to implement the mobile version and social feed and, as a result, we implemented the following screens:
 |
 |
 |
|---|
Implementing analytics as a value prop
At this point, we already had a working proof of the concept being used by employees and early adopters of our client on a regular basis. But together with them, we started thinking about bringing this product to other companies and teams and the ways it could be monetized. Tracking data, sharing it and discussing it wasn’t enough in our opinion to try selling this product. So, we made an assumption that the teams that have enough discipline to track their data could find it valuable to receive insights from it. We then came up with simple analytics that could help in validating this assumption. The page consisted of 4 sections:
- your weekly average
- how you stand compared to your friends
- your spiritual buddy last week
- top contributing vital (the one that influences your mood the most and correlates with it)
![]()
![]()
Result
During the whole development process, 1 part-time Project Manager and 2 full-time middle engineers (frontend and backend) were working from the datarockets side. The PM was involved in the product strategy discussion apart from managing the dev team. Our engineering team participated in feature discussions and suggested ways to make things simpler/faster.
Together with the Pixel Dreams team, we implemented a web application that allows the tracking of personal data such as:
- Journaling (day results, WIN LOSE or DRAW)
- Variety of counters (Book readings, daily calorie intake, etc.)
- Daily checklists (useful routine items, taboos)
Also, we’ve built social features for the teams:
- Teams configuration
- Roles
- Data sharing
- Commenting
- Notifications
- Social feed
- Insights and analytics of vitals that affect / correlate with your mood.
Currently, VITAL is in closed BETA. Together with Pixel Dreams, we are evaluating different business models in order to find a product-market fit and define what improvements we are going to build next.
On the whole, the MVP building process with the implementation of new features and a mobile web app took us 18 weeks (~4.5 months) of development.
Technology Stack
Ruby on Rails, Rspec, Mandrill API, Google oAuth, React.js, Chart.js, Redux, Postgres
Originally published in the datarockets blog
datarockets
Clap to support the author, help others find it, and make your opinion count.